The Consolidator is for anyone who runs more than one MAT Smart Shop store — branches, outlets, a warehouse and a shopfront, or several businesses under one owner. Each store keeps its own sales, its own stock and its own customers exactly as before. The Consolidator sits above them and answers the questions a single store's dashboard cannot: how much did all of my shops collect this month, who owes me across all of them, which branch is carrying the group, and which branch is dragging it — with reports that put every store side by side — plus it is the only place in Smart Shop where you can move stock from one store to another, or change a price in several stores at once.
1. Opening the Consolidator
There is no separate Consolidator login. It uses the Smart Shop account you are already signed in with.
- Sign in to your Smart Shop web portal as usual.
- In the left menu, under Tools, click Consolidator.
- It opens in a new browser tab, shows "Signing you in …" for a moment, and lands on the Dashboard greeting you by name.
If you reach the Consolidator some other way — an old bookmark, a link someone sent you — and you are not signed in to Smart Shop in that browser, it will not ask you for a password. It shows a short message and a Go to my SmartShop Dashboard button instead. Sign in there first, then use the menu link.
Older versions had their own sign-up page. They no longer do: everyone who has a Smart Shop account already has a Consolidator. If you have no account at all, create one on the main site first.
2. The screen and its menu
The dark bar on the left is the whole application. Its links are grouped under four headings, and the page you are on is highlighted in blue.
| Group | Menu item | What it is for |
|---|---|---|
| Overview | Dashboard | The main screen: group figures compared with the period before, sales by store, a store performance table, a list of things that need your attention, best sellers, recent transfers and your store cards. |
| Reports | Seven reports that put your stores side by side: store comparison, profit & loss, sales analysis, items across stores, stock & transfers, money owed and expenses (section 11). | |
| Stores | Stores | One row per store — sales, cost of sales, expenses and profit — for any date range you choose. |
| View Stock | Every product you carry anywhere, with a column per store showing how many each one holds. | |
| Operations | Transfer Items | Move stock from one linked store to another. |
| Update Prices | Change the selling price of many items in several stores at once, from an Excel file or a photo of a price list. | |
| Transfer History | Every transfer you have ever made, with the item list behind each one. | |
| Account | Profile | The name and email this Consolidator runs under. |
| Logout | Signs out of the Consolidator tab only. |
Across the top of every page runs a bar showing where you are (for example Consolidator / Reports) and, on the right, a round badge with your initials and your name. Click it for Profile and Logout. The bottom of the left menu reminds you which account you are signed in as.
The older pages (Stores, View Stock, Transfer Items, Update Prices, Transfer History, Profile) keep their Add A Store and Transfer Items buttons at the top right. On the Dashboard the same buttons sit beside the greeting, together with a Reports button.
On a phone or small tablet the left menu is tucked away. Tap the ☰ button at the top left to open it, and tap anywhere outside it to close it again.
3. Adding a store
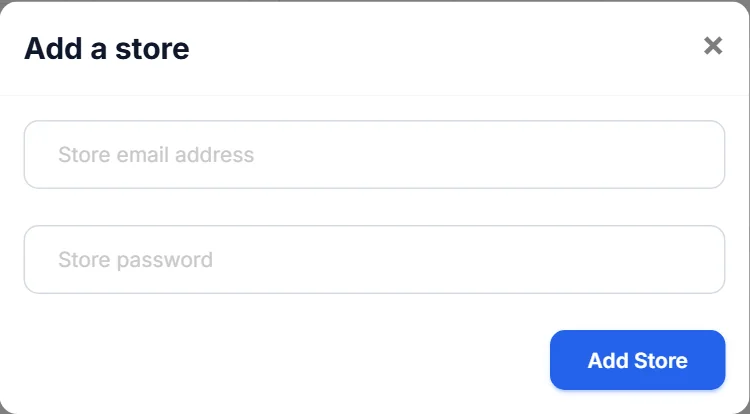
Click Add a store (beside the Dashboard greeting, at the top right of the older pages, or the dashed Add a store card at the end of Your stores). There are two ways in, and the window opens on whichever one applies to you.
(a) One of my own stores
If your Smart Shop account already has access to stores you have not linked yet, the window opens with a drop-down list of them. Pick one and click Add Store. No password is needed — you are already proven to own it.
(b) Link a different store
To bring in a store that is not on your account — a partner's shop, a business registered under a different email — click link a different store, then enter that store's admin email address and password and click Add Store.
If you have no unlinked stores of your own, the window skips straight to the email-and-password form. You can move between the two modes with the small pick one of my own stores / link a different store link underneath.
What you may see when it does not work:
| Message | What it means |
|---|---|
| This store has been added already. | It is already in your list — close the window and look for it in Your stores. |
| That store isn't linked to your account. | You chose an own-store entry your account no longer has rights to. Use the email-and-password route instead. |
| Invalid posting ensure that store login detail is correct. | Wrong email, wrong password, or an account that is not that store's admin. |
| Something went wrong. Please try again. | The request did not reach the server. Check your connection and retry. |
On success the page reloads and the new store appears everywhere at once — as a card, in the store filter, on the charts and tables of the Dashboard and Reports, as a column on View Stock, and in both store lists on Transfer Items.
Adding a store changes nothing inside that store. Its staff, prices, stock and receipts carry on untouched; you have only been given a window onto it.
4. Removing a store, and opening one
Each card under Your stores at the bottom of the Dashboard has three controls:
- Open store — opens that store's own Smart Shop dashboard in a new tab, signed in as its administrator, so you can drill into a branch without logging out of anything. The Open button at the end of each row of the Store performance table does the same.
- Reports — jumps to the Store comparison report.
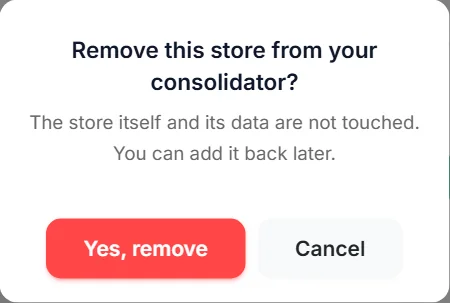
- ✕ in the top right corner of the card — remove this store. You are asked "Remove this store from your consolidator?" and must click Yes, remove. Cancel leaves everything as it was.
5. Dashboard — choosing the dates and the stores
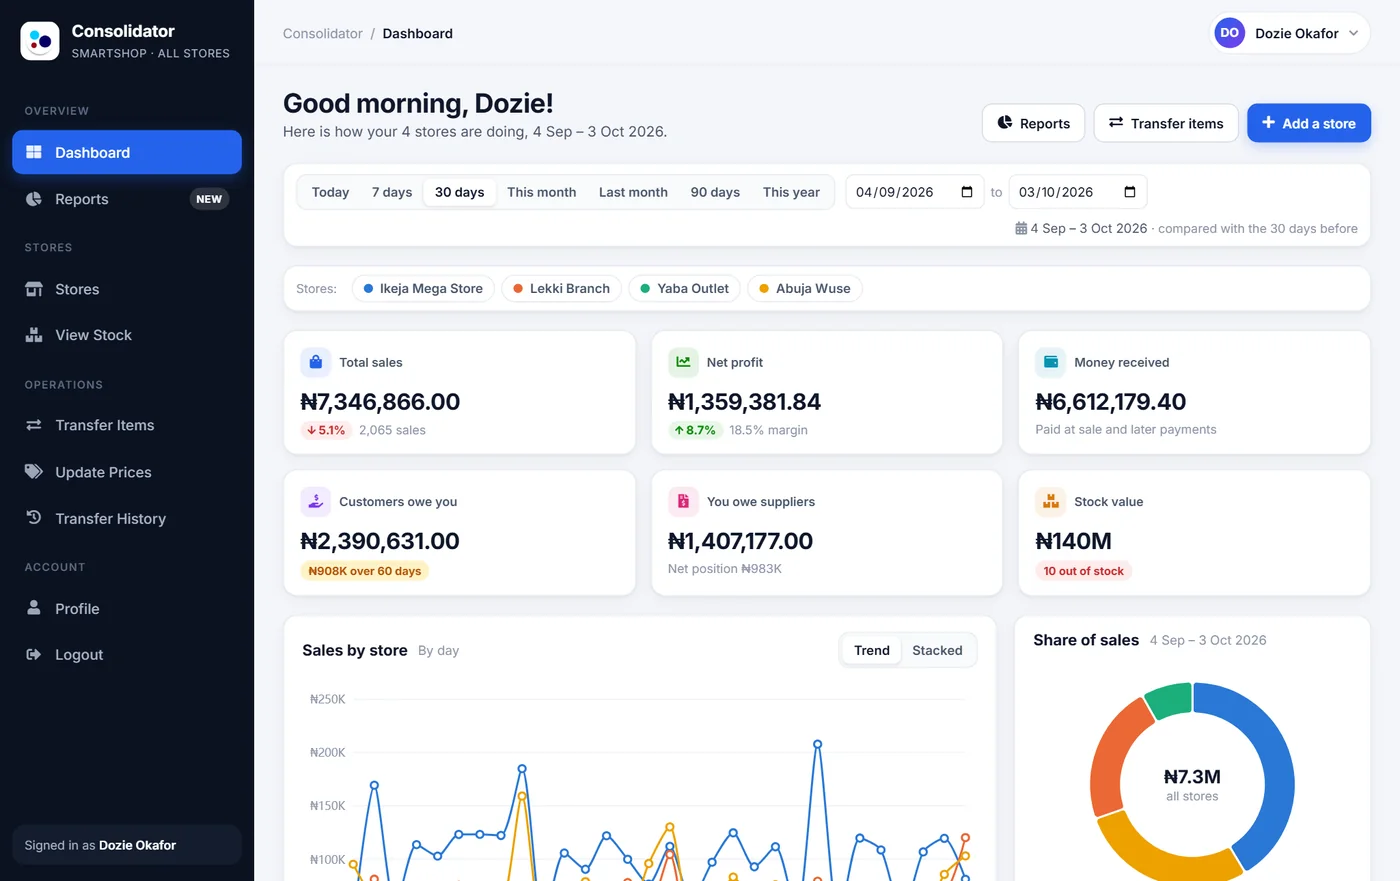
Two bars sit under the greeting. Everything below them follows what you choose here.
The date bar
Click a shortcut — Today, 7 days, 30 days, This month, Last month, 90 days or This year — or type your own from and to dates in the two boxes. The page reloads as soon as you choose; there is no Apply button. The chosen span is written out on the right, for example 4 Sep – 3 Oct 2026 · compared with the 30 days before.
The Dashboard opens on 30 days the first time, then remembers your last choice on that computer and browser.
The store filter
With two or more stores linked, a row of store names appears under the dates, each with its colour dot. Click a store to leave it out of the figures, charts and tables (it fades); click it again to bring it back. One store always stays switched on. The choice is remembered on that browser and is shared with the Reports page. It does not hide anything from Your stores or Recent transfers.
6. Dashboard — the six headline figures
Six cards add up the stores you have switched on.
| Card | What it counts | Follows the dates? |
|---|---|---|
| Total sales | Sales after discounts in the period, with the change against the period before and the number of sales. | Yes |
| Net profit (or Net loss) | Sales minus the cost of the goods sold minus expenses, with the change against the period before and the profit margin (profit as a share of sales). Shown in red when it is a loss. | Yes |
| Money received | Money that actually came in during the period: paid at the time of sale, plus later payments against credit sales. | Yes |
| Customers owe you | What your customers still owe, across all the stores. An orange note shows how much of it is more than 60 days old. | The end date only — balances as they stood on the last day of the period (today, for ranges that end today) |
| You owe suppliers | What you still owe your suppliers. Underneath: your net position — what customers owe you minus what you owe suppliers. | The end date only |
| Stock value | What all the stock on your shelves cost you, and a red note with how many items are out of stock. | No — always today |
Large amounts are shortened (₦140M, ₦908K). Rest the mouse on a card to see the exact figure.
7. Dashboard — Sales by store, and share of sales
Sales by store draws one line per store, day by day (month by month for ranges longer than three months). Rest the mouse on any day to see every store's sales for that day and the total for all of them. The Stacked switch at the top right piles the stores on top of each other instead, so the height of each bar is the group's total for that day; Trend switches back.
Share of sales, beside it, is a ring showing how the period's sales split between your stores, with the group total in the middle and a list underneath giving each store's percentage.
8. Dashboard — Store performance
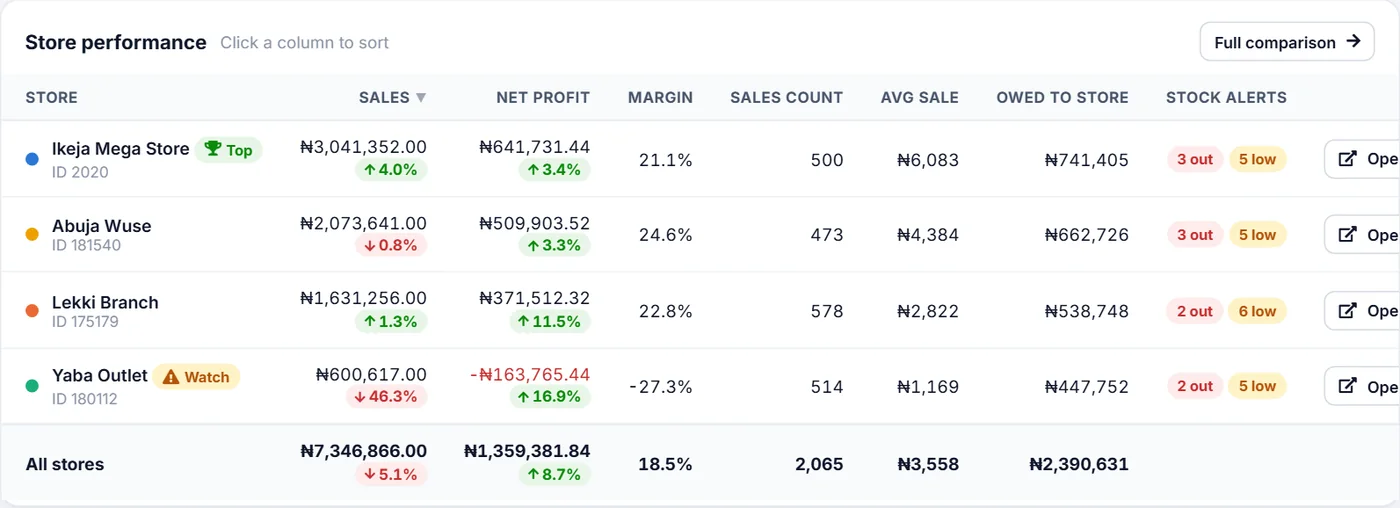
One row per store with the figures that matter most, and an All stores row at the bottom. Click any column heading to sort by it; click again to reverse the order.
| Column | Meaning |
|---|---|
| Store | The store name, its colour dot and its ID (the number to quote to support). |
| Sales / Net profit | For the period, each with its change against the period before. |
| Margin | Net profit as a percentage of sales. A negative margin is a loss. |
| Sales count / Avg sale | How many sales were made, and the average value of one sale. |
| Owed to store | What that store's customers owe it. |
| Stock alerts | How many items are out of stock (red) and running low (orange). OK when there are none. |
| Open | Opens that store's own dashboard in a new tab. |
| Badge | When it appears |
|---|---|
| 🏆 Top | The store with the highest net profit for the period (only with two or more stores). |
| ⚠ Watch | The store with the lowest net profit — but only if it made a loss or its sales fell by 20% or more. A store that is simply a little behind the others is not flagged. |
Full comparison at the top right of the table opens the Store comparison report, which has every figure (section 11).
9. Dashboard — Needs your attention, best sellers and recent transfers
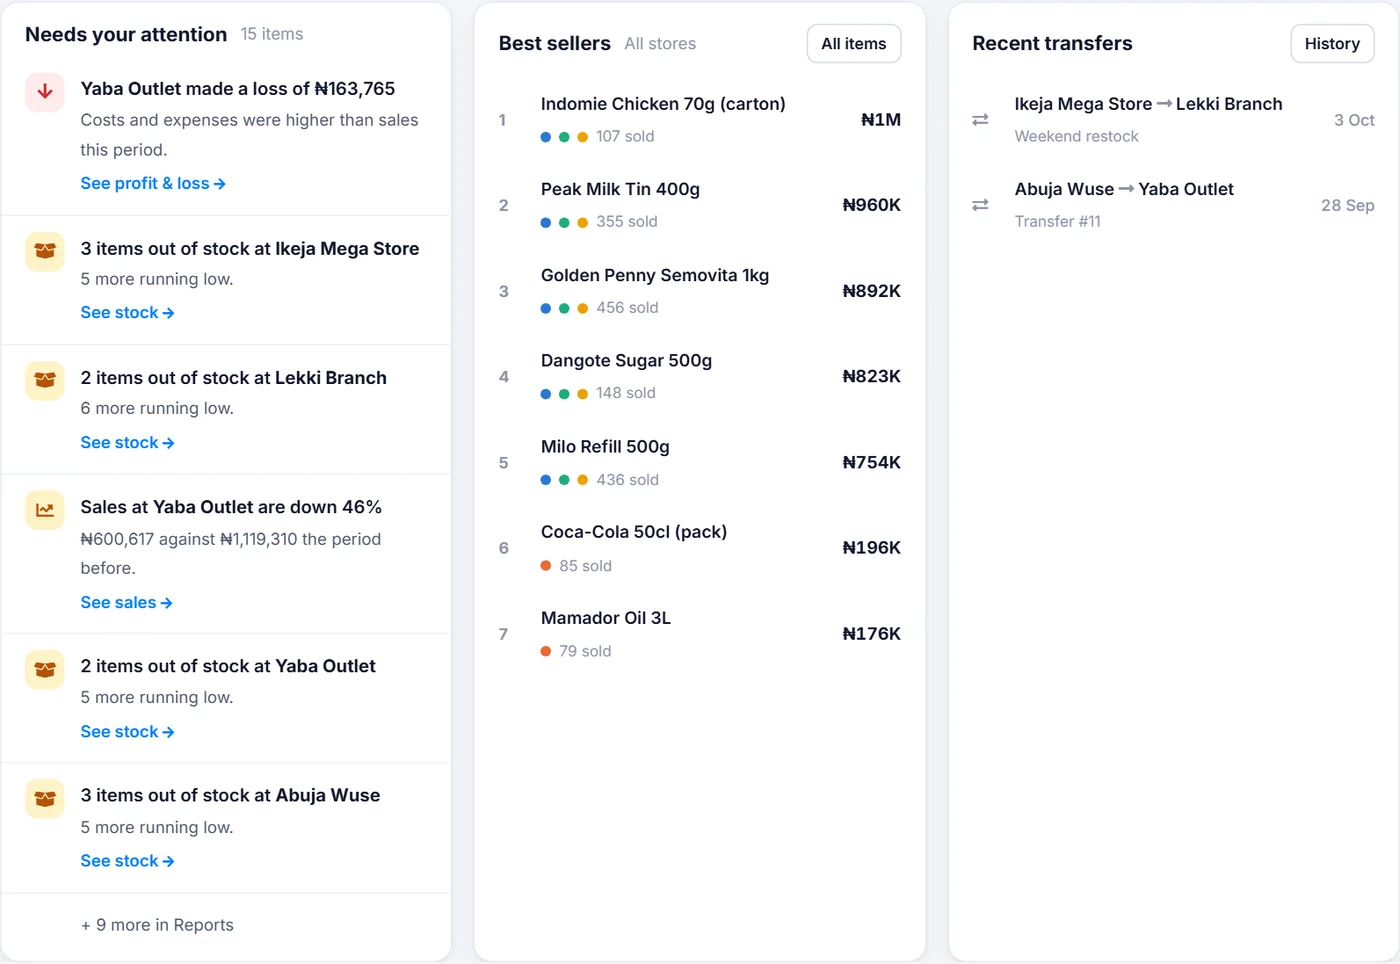
Needs your attention
A to-do list the Consolidator builds for you from the period's figures, most serious first. Each line has a link to the report that explains it. It can contain:
| Line | Why it appears |
|---|---|
| No sales recorded at a store | Nothing at all in a period of three days or more. If the store did trade, its till or phone is probably not syncing. |
| A store made a loss | Its cost of sales plus expenses were higher than its sales. |
| Sales at a store are down | Down 20% or more against the period before. |
| Items out of stock at a store | With the number running low as well. |
| Money owed for over 60 days | Customers of that store who have owed money for more than two months. |
| Batches expiring within 30 days | Stock with an expiry date coming up — sell it first, or move it to a busier store. |
| Move stock instead of reordering | Some stores are short of items that others have too much of. The Stock & transfers report lists exactly what to move. |
Up to six lines are shown; the rest are counted underneath. All clear means there is nothing to flag for the period.
Best sellers
The items that brought in the most money across the stores you have switched on, with the coloured dots of the stores that sold them and the number of units sold. It is built from each store's own top five, so an item that sells steadily in every store but is never in any one store's top five will not appear here — the Items across stores report (All items) has the full list.
Recent transfers
Your last six stock transfers: which store to which, the description, and the date. History opens Transfer History.
10. Dashboard — Your stores
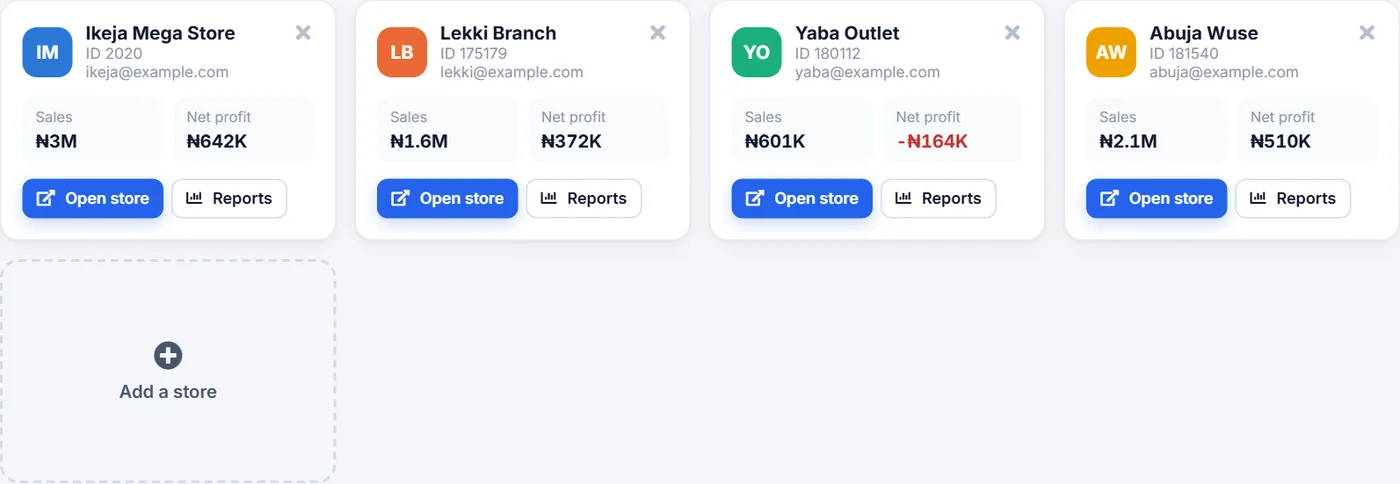
At the bottom of the Dashboard, one card per linked store: its initials in its colour, its name, ID and email, and its Sales and Net profit for the chosen period. The buttons are described in section 4. The dashed Add a store card at the end opens the Add a store window.
11. Reports — your stores side by side
Click Reports in the left menu (or the Reports button on the Dashboard). Seven reports sit on tabs across the top. Every figure in them comes from the stores' own reports — the same numbers each store sees on its own Smart Shop portal — lined up so you can compare.
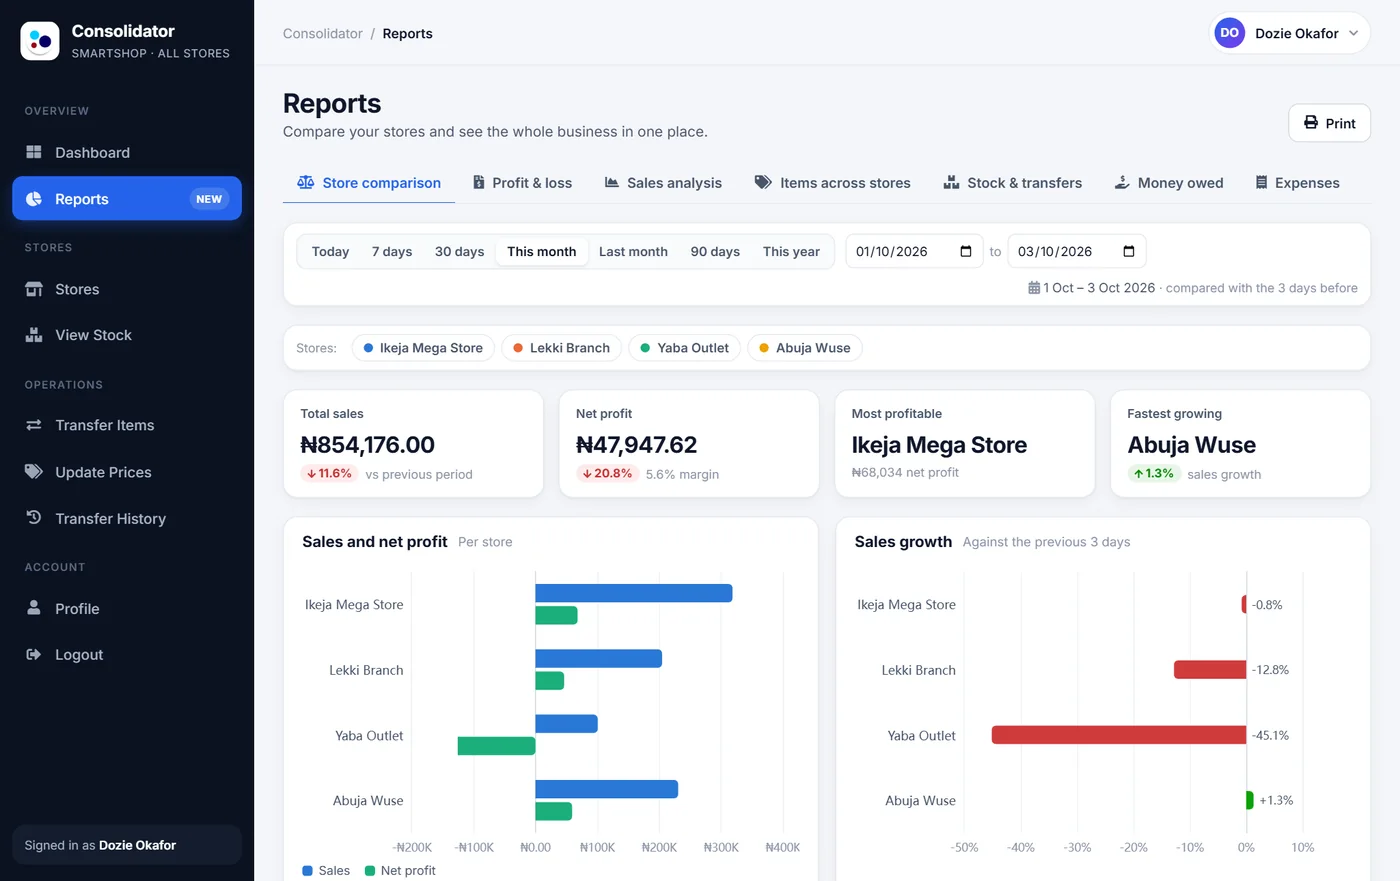
Choosing what to look at
- Dates — the same date bar as the Dashboard (section 5). It opens on This month and remembers your choice. One date bar serves every tab, so switching tabs keeps the same period.
- Stock & transfers and Money owed always show things as they stand today, so on those two tabs the date bar is replaced by a short note saying so.
- Stores — the same store filter as the Dashboard. Leave stores out to compare just a few.
- Most tables can be sorted by clicking a column heading, and long lists have a search box.
- Print (top right) prints the tab you are on, without the menus — or save it as a PDF from the print window.
The first time you open a tab for a period it gathers the figures from every store, which can take a few seconds with many stores. Coming back to the same tab for the same period is instant.
11.1 Store comparison
Four cards: Total sales and Net profit for the group, the Most profitable store and the Fastest growing store (biggest rise in sales against the period before). Two charts: Sales and net profit per store, and Sales growth — each store's change in sales as a percentage, green for up and red for down. Under them, the Side by side table gives every figure for every store: sales and the previous period, cost of sales, gross profit and gross margin, expenses, net profit and net margin, sales count, average sale, items sold, customers, sold on credit, money received, what customers owe, what the store owes suppliers, stock value and items out of stock. Scroll sideways to see them all.
11.2 Profit & loss
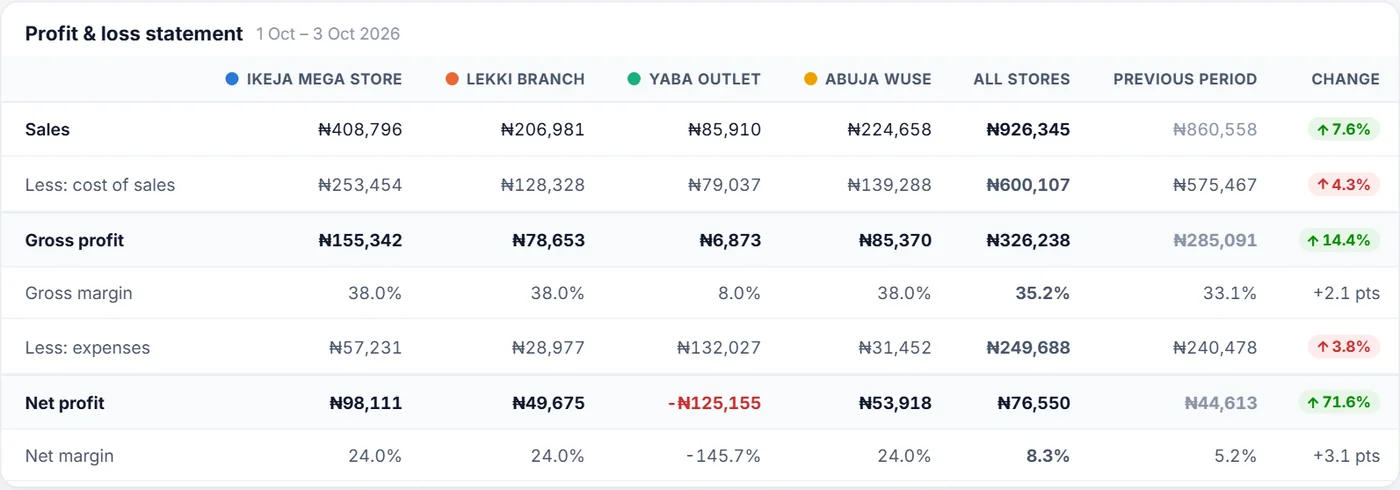
A proper statement: Sales, less cost of sales, gives Gross profit (and gross margin); less expenses gives Net profit (and net margin). There is a column for each store, an All stores column, the group's Previous period, and the Change. Margins change by percentage points (+2.1 pts).
Below it, Where each store's sales went splits every store's sales into cost of sales, expenses and what was left as profit — a store with a short green section keeps little of what it sells. When the period covers two or more months, Net profit by month draws one line per store. Expenses by type lists every expense type with a column per store.
11.3 Sales analysis
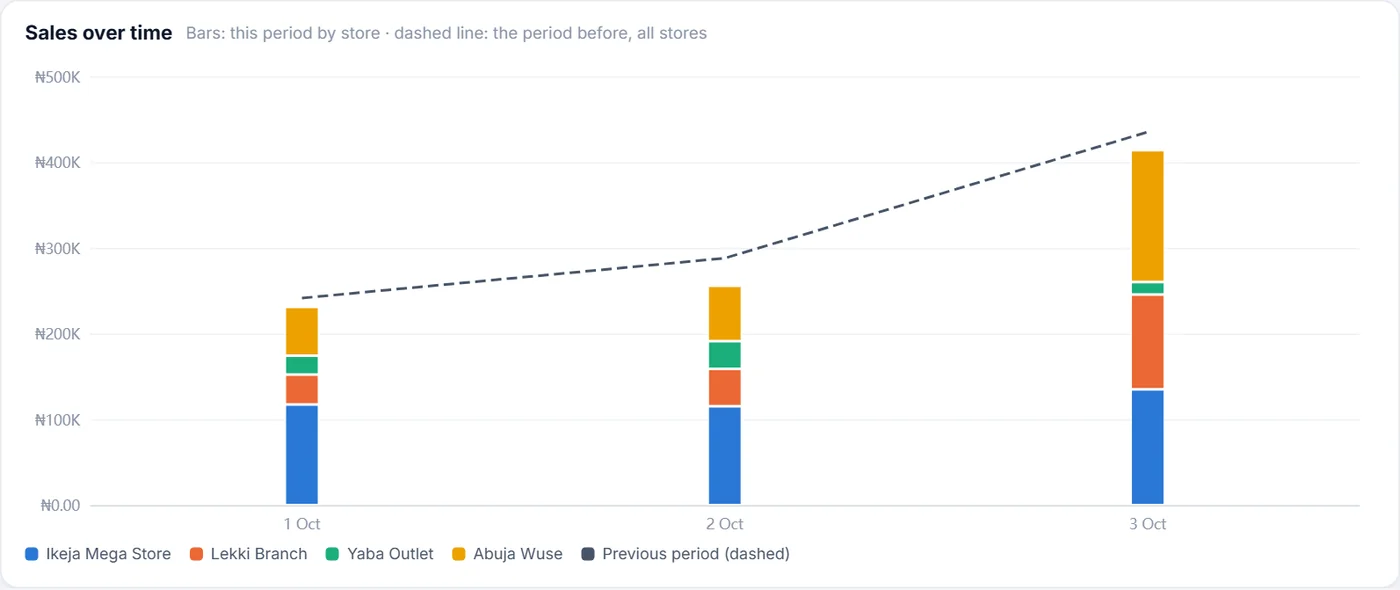
Six cards for the group: net sales, number of sales, average sale, items sold, sold on credit, and discounts given, each compared with the period before. Then:
- Sales over time — a bar per day, stacked by store, with a dashed line for the same days of the period before.
- How customers paid — cash, transfer, POS and your other payment types, each bar split by store.
- Busiest times — a grid of days (Monday to Sunday) against hours of the day. The darker the square, the more you sold then. Use it to plan staff and opening hours.
- Who sold — switch between Cashiers, Tills, Sales classes and Payment types to see each one's sales and its share of its store's sales.
11.4 Items across stores
Every item sold in the period, store by store. Top 10 items charts the leaders, stacked by store; switch it between Sales value, Quantity and Profit (the table below follows the same switch). Every item, store by store has a column per store, an All stores total and the margin. A dash means the item did not sell in that store. Use the search box to find an item; the list shows the top 300.
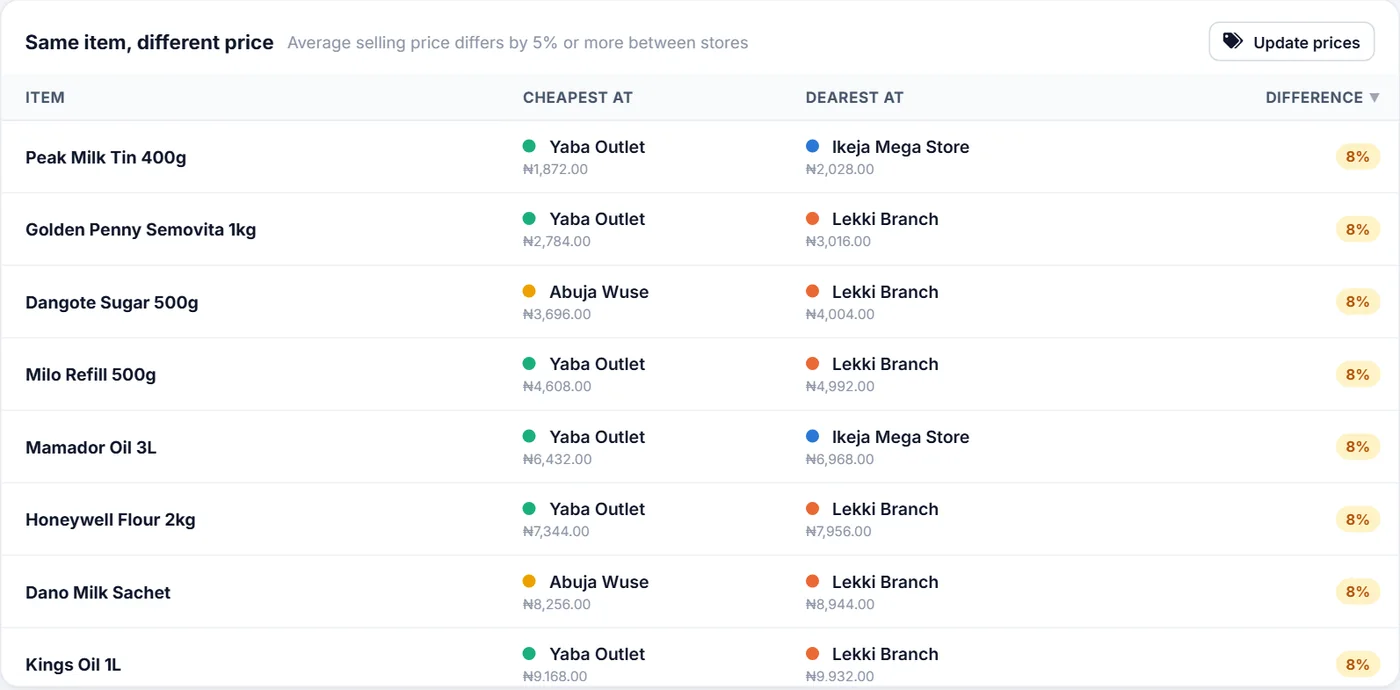
Same item, different price lists items whose average selling price differs by 5% or more between your stores, showing where each is cheapest and dearest. Differences of 20% or more are marked red. If the stores should charge the same, Update prices takes you to Update Prices (section 14).
11.5 Stock & transfers
Four cards: the stock value at cost, its value at selling price, the number of items out of stock (and running low), and how many transfers are suggested.
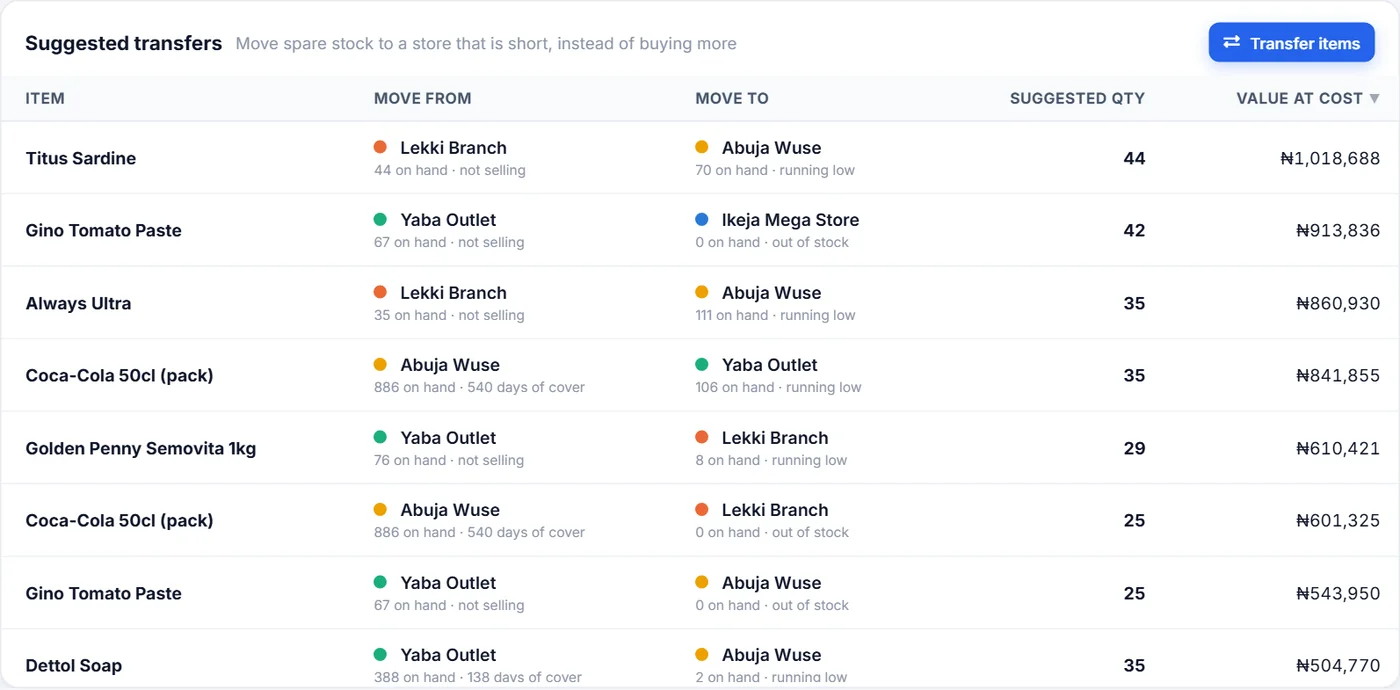
Suggested transfers is the Consolidator's own idea of what to move, instead of buying more:
- A store is short of an item when it is out of stock, at its reorder level, or will run out within a week at its current speed of sale.
- Another store has it spare when the item has not sold there in the last 30 days, or it holds more than 60 days' worth. The suggestion always leaves the sending store at least 45 days' worth of its own sales.
- The suggested quantity is what the short store needs for about a month, limited to what the other store can spare. Value at cost shows what the stock being moved is worth.
Nothing moves by itself. When you agree with a line, click Transfer items and make the transfer as usual (section 13).
Under it: Stock health by store counts each store's items in five states — Out of stock, Low / reorder, Healthy, Overstocked (more than six months' worth) and Not selling (no sales in 30 days); Store by store gives each store's stock value, counts and batches expiring within 30 days; Stock on hand, every store shows every item with a column per store, coloured red (out), orange (low), blue (overstocked) or grey (not selling) — tick Problems only to see just the shortages; and Batches expiring soon lists batches expiring within 90 days, or already expired, with the store, quantity left and value.
11.6 Money owed
Switch at the top between Customers owe you and You owe suppliers. Four cards give the total, how much is over 90 days and over 60 days old, and any credit (customers who paid ahead, or money paid ahead to suppliers).
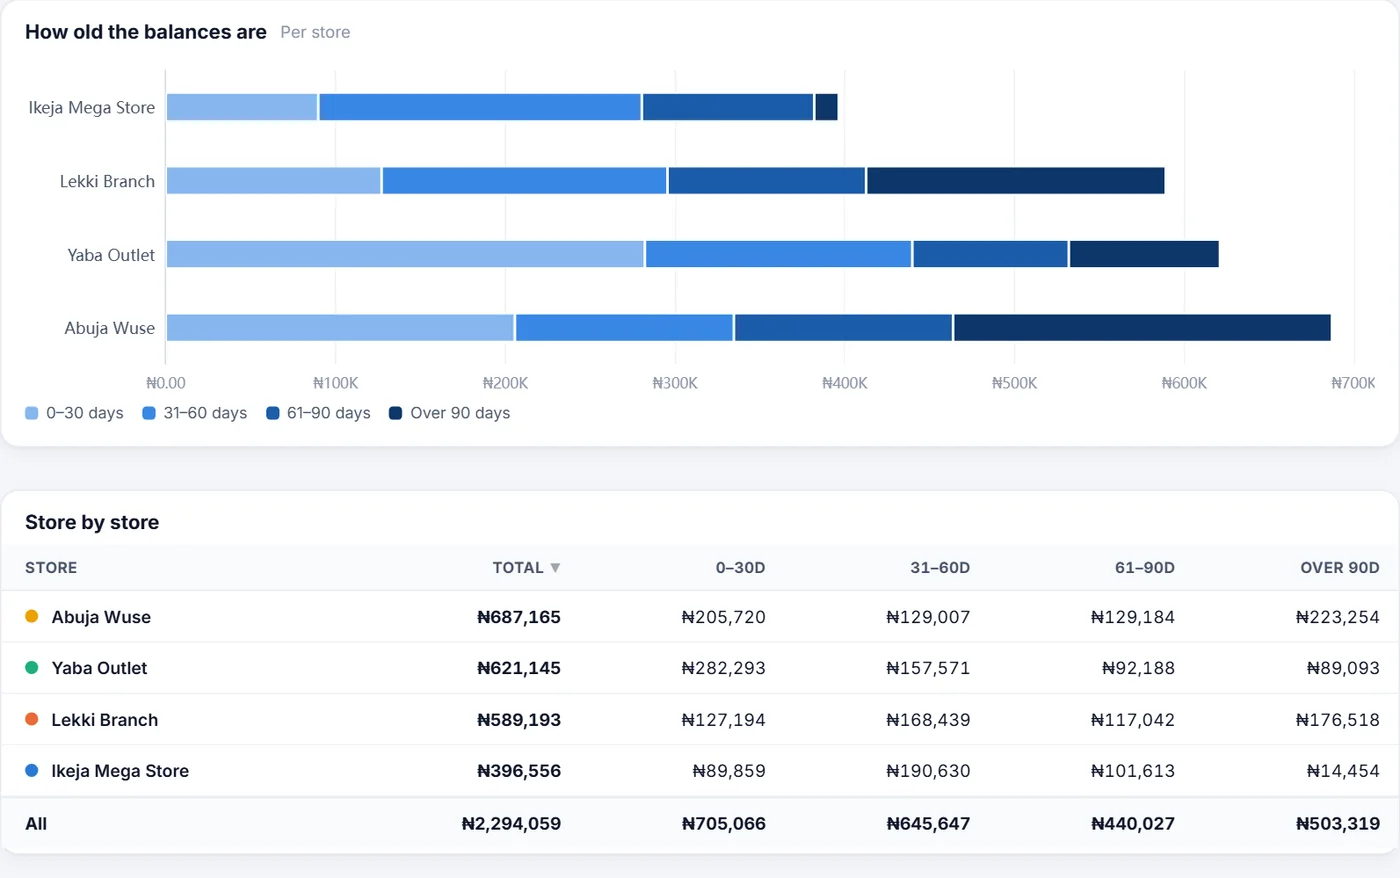
How old the balances are splits each store's total into 0–30, 31–60, 61–90 and over 90 days. The older the debt, the harder it is to collect — a long dark section is the one to chase. Who owes the most lists every customer (or supplier) with their store, phone, balance, the part over 90 days, the oldest unpaid invoice and when they last paid. Search by name or phone.
11.7 Expenses
Total expenses for the group against the period before, the biggest expense type and the store that spends the most. Top expense types charts the ten biggest types, split by store; Store by store compares each store's expenses with its previous period; and Every expense type, store by store lists every type with a column per store and the change. A rise in expenses is shown in red.
12. View Stock — the consolidated stock matrix
View Stock answers the question that costs multi-branch shops the most money: we are out of it here — does another branch have it?
It builds one table: one row per product, and one column per store, with that store's quantity in the cell. A zero means that store does not currently hold it. The heading tells you how many stores are in the table.
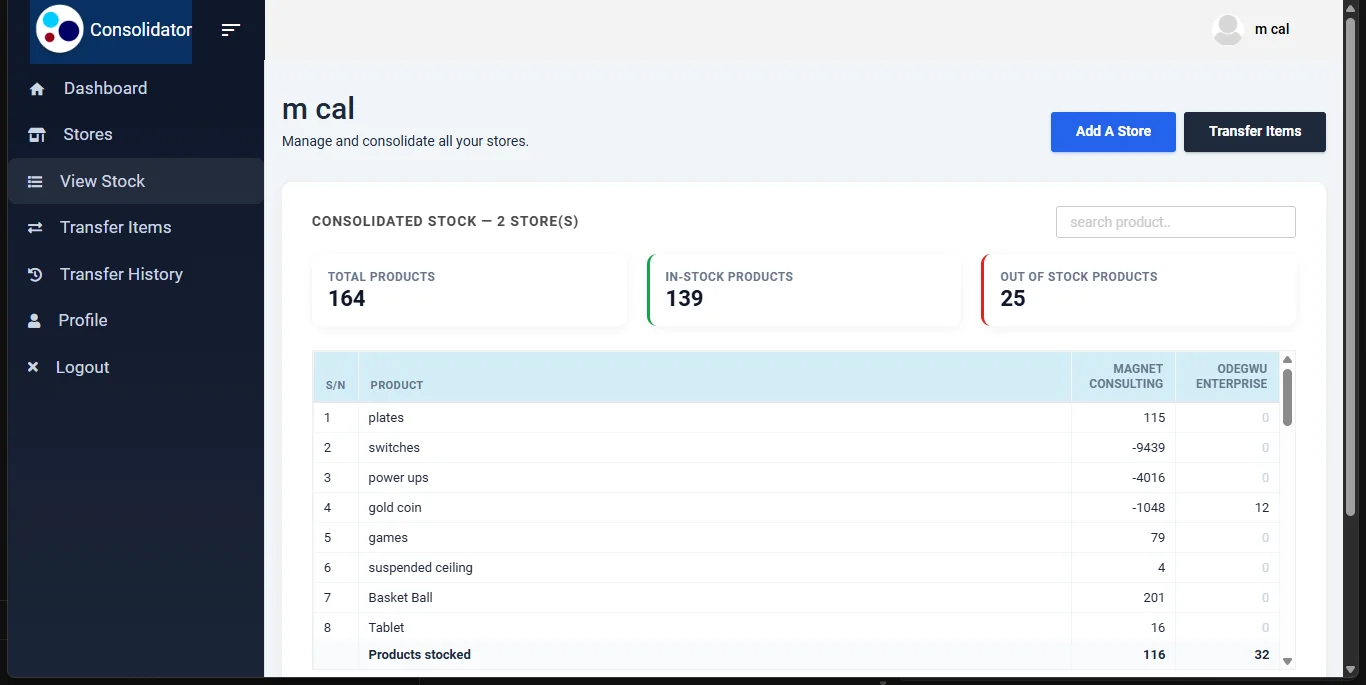
Three cards sit above it, all of them counts of products:
| Card | Meaning |
|---|---|
| Total Products | How many distinct products exist across all your stores together. |
| In-Stock Products | How many of them at least one store currently holds. |
| Out of Stock Products | How many are at zero everywhere — the group-wide gap. |
The bottom row of the table, Products stocked, counts how many different products each store currently holds. It is a count of lines, not a sum of units.
How products are matched across stores
The same product in two stores is recognised by name — trimmed and case-insensitive, so "Peak Milk 400g" and "peak milk 400g " are treated as one row. Each store keeps its own internal item numbers, so the name is the only shared identity available.
Services are excluded. A stock matrix is about physical things; services have no quantity to hold.
Finding things
The search product… box filters the entire catalogue, not just the page you are looking at. The table shows 50 products a page with a numbered pager beneath it, and the line under the table tells you what you are looking at — for example Showing 1–50 of 214 products (filtered from 900). The header row and the totals row stay in place while the rows scroll.
Column headings are shortened when your stores share a long name: branches called "Popsicles by Happie hours (Town square)" and "Popsicles by Happie hours (Lekki)" are headed Town square and Lekki, because the shared part tells you nothing in a narrow column. Hover any heading for the full store name and its Store Id.
If one store's stock cannot be loaded, an orange warning names it and its column reads zero throughout — so a zero you were not expecting always has an explanation on screen.
13. Transfer Items — moving stock between stores
This is the only place in Smart Shop that moves stock from one store to another. It records the movement on both sides: goods leave the source, arrive at the destination, and both stores' stock figures change to match.
Step by step
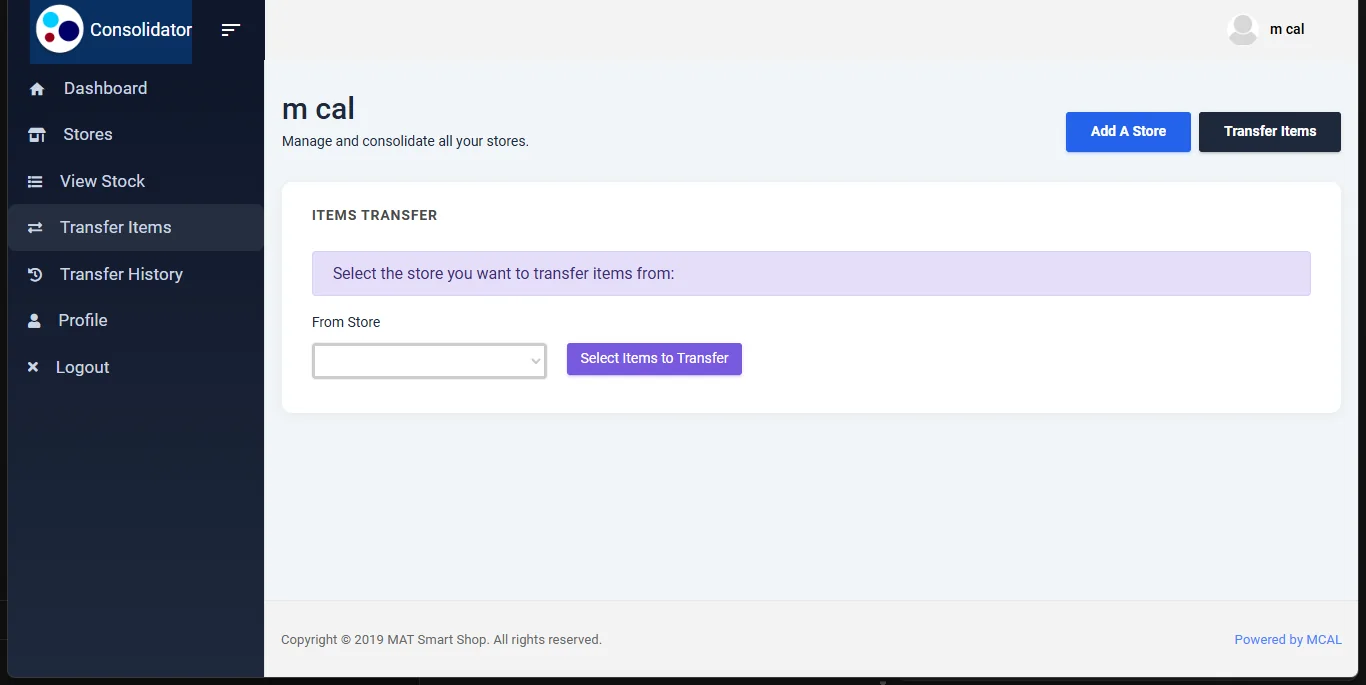
- From Store — choose where the goods are leaving from. Do this first; the item list is read from this store.
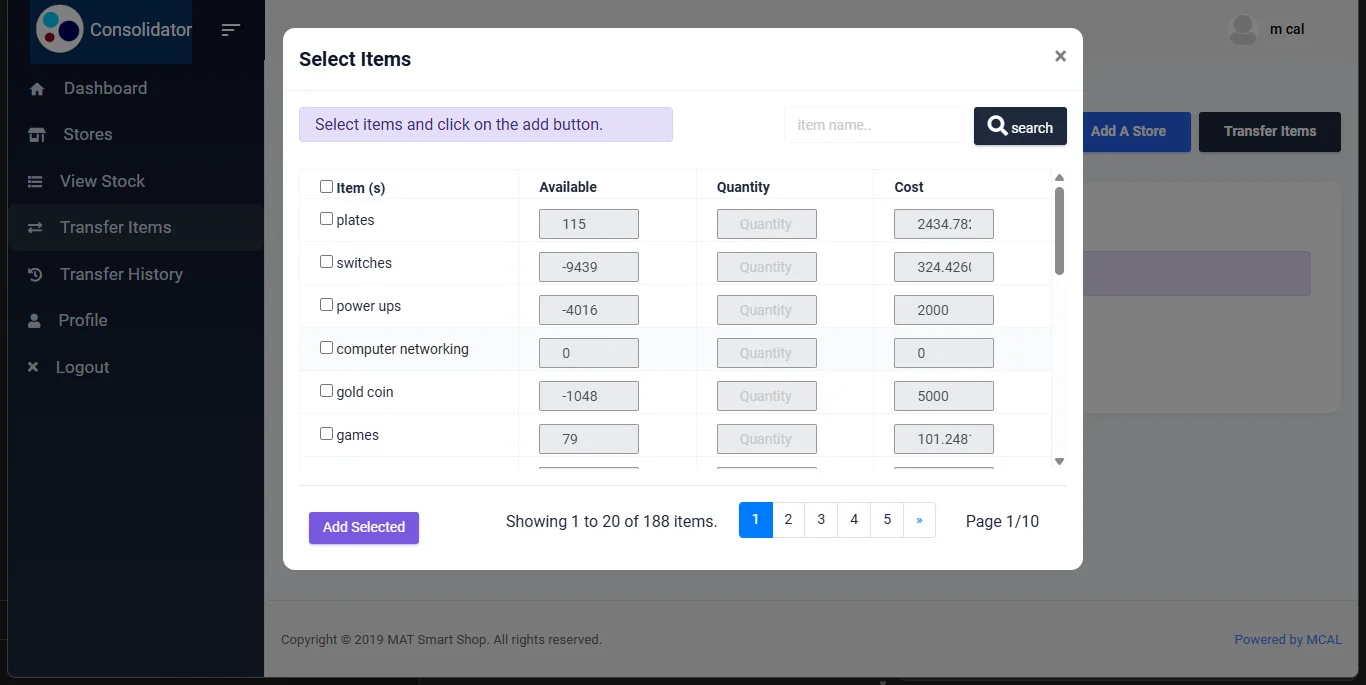
- Click Select Items to Transfer. A window lists that store's items with Available, Quantity and Cost columns.
- Tick an item. Its Quantity box switches on — type how many you are sending. Use the item name… search box and the pager to find things; Item (s) at the top ticks everything on the page at once.
- Click Add Selected. The window closes and the rest of the form appears.
- Transaction Date — the date the goods actually moved.
- To Store — where they are going.
- Check the table of selected items. New Cost is editable and starts at the source cost — this is the cost the goods will be valued at in the receiving store. Selling Price is what the receiving store will sell each item for (see below). The grey ✕ button removes a line.
- Type a short transfer description (it is saved in upper case, and it is what you will recognise this transfer by later).
- Click Validate. Each item is looked up in the destination store by name. A tick means it is already there and will be topped up. "Not in the destination store — it will be created there" means a new item will be made in that store; untick that line's box to leave it out of the transfer instead. The line dims and reads "Left out". Or pick the matching item that store already has from the search box under the message (see below).
- Click Save. On success the form clears and confirms Item (s) Transferred Successfully.
Adding an item that is already on the list replaces that line with the new quantity, rather than adding a second line for the same item. If you change the To Store after validating, click Validate again — Save checks the items against the store they were validated for.
What the system checks for you
| Check | Message |
|---|---|
| A quantity was typed for every ticked item | You must enter quantity to transfer |
| You are not sending more than the store holds | You can not transfer more than your available quantity |
| A destination store was chosen before validating | Please Select Recipient Store |
| From store, To store, date and at least one item are all present | Please Select From Store / To Store / Date / Item to Transfer |
| Every line has a cost and a new cost | Please Enter All Cost For Selected Item(s) |
| The items were validated against the destination you are saving to | Please click Validate before saving |
| At least one line is still included | Nothing to transfer — every item has been left out |
| Every line has a selling price above 0 | Please enter a selling price above 0 for each item. |
What a saved transfer actually does
- Records a TRANSFEROUT movement in the source store and a TRANSFERIN movement in the destination, each carrying its own cost, so both stores' costing stays honest.
- Reduces the source store's stock figure and increases the destination's by the same quantity.
- If the destination had no such product, creates it — copying the name, item type, reorder level and tax setting from the source, pricing it at the Selling Price on the transfer, and valuing it at the New Cost you entered.
- For an item the receiving store already has, sets that store's price to the Selling Price on the transfer — unless you unticked Update price there on that line.
- For a line you matched by hand with Rename it there ticked, gives the receiving store's item the source item's name.
- Writes the whole thing to Transfer History, where the item list stays available forever.
Matching an item that has a different name
Validate pairs items by exact name. If the receiving store sells the same product under a different name — "Peak 400g Milk" instead of "Peak Milk 400g" — the line says it will be created. Instead, click the search box under that message and pick that store's own item. Before you type, the closest names are listed first; each shows how many that store has and what it sells at.
- Matched: the line reads "Matched to … — the stock is added to it". Nothing new is created. Undo puts the line back to "will be created".
- Its price follows the Update price there tick, like any item that store already has.
- Rename it there to "…" (off by default) gives that store's item the source store's name, so the next transfer pairs them automatically and View Stock shows them on one row.
- Only that store's active items are listed. If you change the To Store, click Validate again — a match only applies to the store it was made for.
Setting the selling price in the receiving store
The Selling Price column is what each item will sell for in the store receiving the goods. It starts at the source store's price, and you can type a different one. After Validate, an item the receiving store already has gets an Update price there tick under its price — ticked by default.
| After Validate, the line is… | Under the price | What Save does |
|---|---|---|
| An item the receiving store does not have yet | Nothing | Creates the item there at the price in the box. |
| An item it already has — Update price there ticked (default) | "Will change the price there from …", or "Same as the price there" | Sets that store's price to the price in the box. |
| An item it already has — Update price there unticked | "Keeps the price there: …" (the box is dimmed) | Leaves that store's price as it is. |
14. Update Prices — new selling prices across several stores
Use this when a price changes group-wide — a supplier puts up the price of milk, and every branch needs to charge the new price. Instead of opening each store and editing each item, give the Consolidator one list of item names and new prices, choose the stores it applies to, check the changes, and confirm once. It is a separate menu from Transfer Items: nothing moves between stores, and no stock changes.
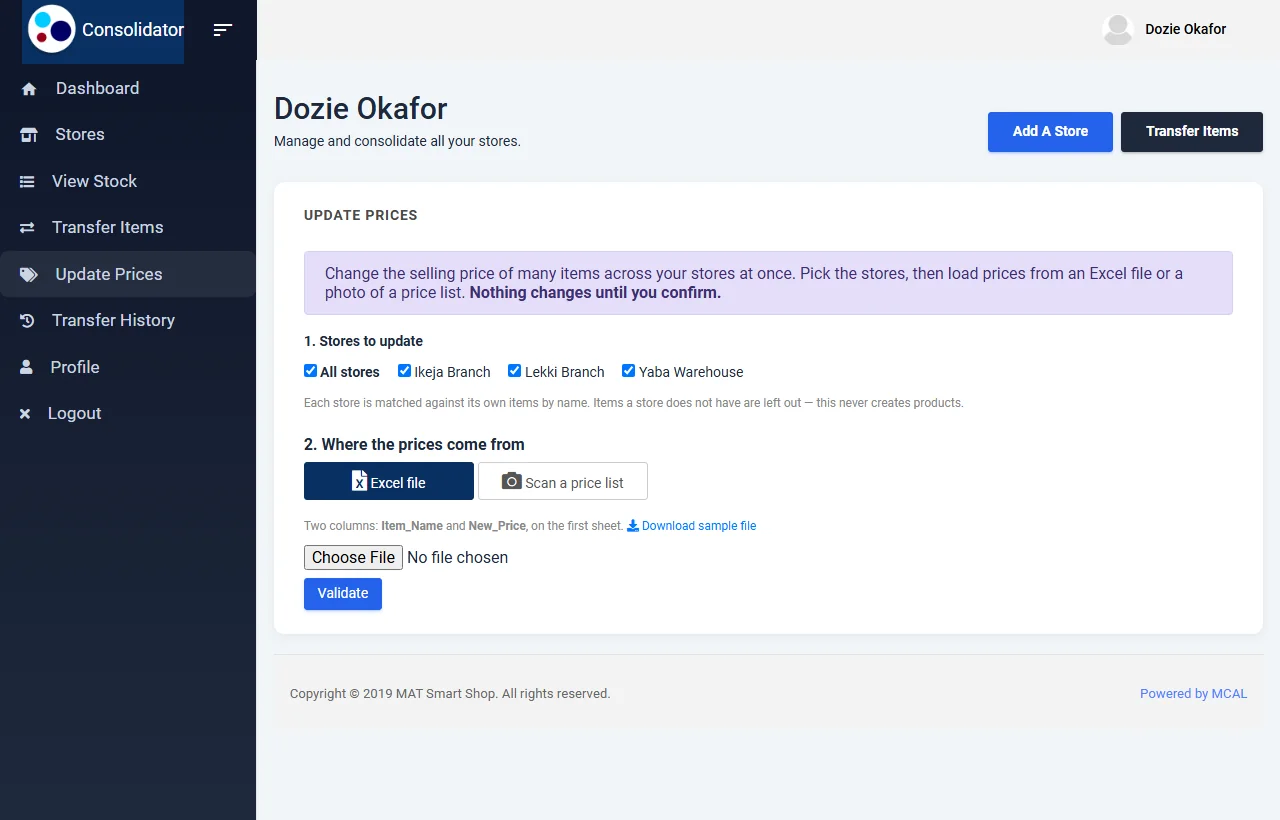
Step by step
- Click Update Prices in the left menu.
- 1. Stores to update — tick each store the new prices should apply to, or tick All stores.
- 2. Where the prices come from — choose one:
- Excel file — a spreadsheet with two columns, Item_Name and New_Price, on the first sheet. Download sample file gives you the layout. Choose the file and click Validate.
- Scan a price list — a clear photo of a printed or handwritten price list: item names on the left, prices on the right. A long list can be photographed in parts; choose all the photos together. Pick which store's DocScan units pay for the reading under Use DocScan units from, then click Read photos.
- The Price Changes table appears. Check it (see below), untick anything you do not want, and correct any price in its New Price box.
- Click Confirm and Update Prices and answer OK. The page confirms how many prices were changed.
Reading the Price Changes table
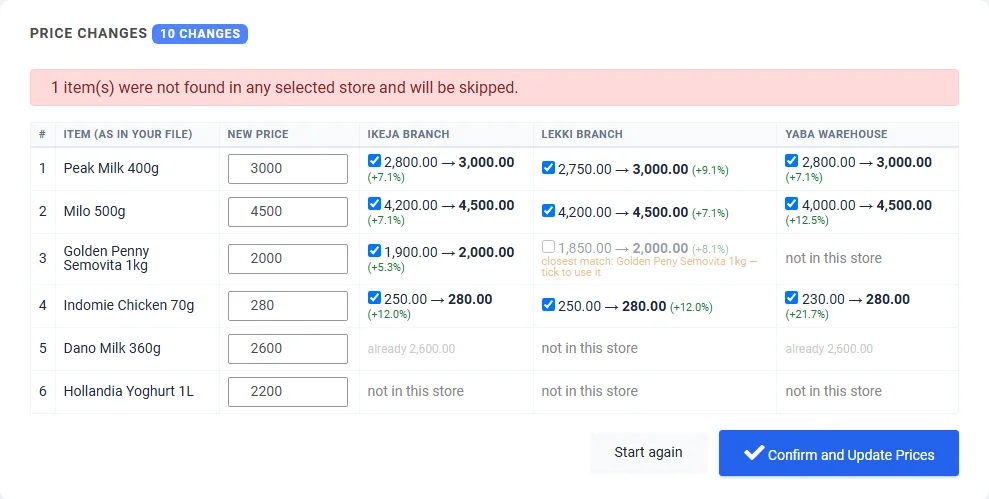
Each item in your list is looked up in each store separately, by name, against that store's own items. So one row can be changed in two branches and left alone in a third.
| A store's cell shows… | What it means | What Confirm does |
|---|---|---|
| A tick, current price → new price and the % change | That store has the item under exactly that name. | Changes that store's price. |
| Unticked, with "closest match: … — tick to use it" | The store has an item with a very similar name (a letter different, or a spelling the scanner tidied). It might be the same product — or might not. | Nothing, unless you tick it. Tick it only if that item really is the one. |
| already … | That store already charges that price. | Nothing. |
| not in this store | No item with that name, or anything close, in that store. | Nothing. Update Prices never creates items. |
The badge beside Price Changes counts the ticked changes across all stores. Coloured notes above the table tell you when:
- the same item name appeared more than once in your list — the last price for it is used;
- a line was read without a price (usually from a photo) — type one in its New Price box, or it is skipped;
- an item was not found in any of the chosen stores — it is skipped.
Changing which stores are ticked after the table appears rebuilds it for the new set of stores, keeping the prices you typed.
What the system checks for you
| Check | Message |
|---|---|
| At least one store is ticked | Please tick at least one store to update. |
| Every row in the spreadsheet has a name and a price above 0 | Please fix these rows and upload again (lists each bad row by its row number) |
| A big move is intended | The confirmation says how many prices move by more than 100% |
| The photos could be read | No prices could be read off that photo — try a clearer, straighter photo with good light |
| The chosen store has DocScan units left | Store is out of DocScan units — buy usage units in that store, or bill the scan to another store |
What a confirmed update actually does
- Changes the selling price of each ticked item in each ticked store. Nothing else about the item changes — not its name, cost, stock or tax.
- Marks each item as edited, so that store's phones and tills pick up the new price on their next sync. Until a device syncs, it keeps selling at the old price.
- Affects sales from that moment on. Sales already made keep the price they were made at.
- Only touches stores linked to your Consolidator. If a store has been removed in the meantime, nothing in the batch is changed and you are asked to try again.
15. Transfer History
Every transfer you have ever saved, newest first, with a search box and pager over the top.
| Column | What it shows |
|---|---|
| S/N | Row number. |
| Transfer Date | The transaction date you entered — the date the goods moved. |
| From / To | Source and destination store. |
| Description | The text you typed, in upper case. This is why a meaningful description is worth the five seconds. |
| Details | Opens a window listing every item in that transfer and the quantity sent. |
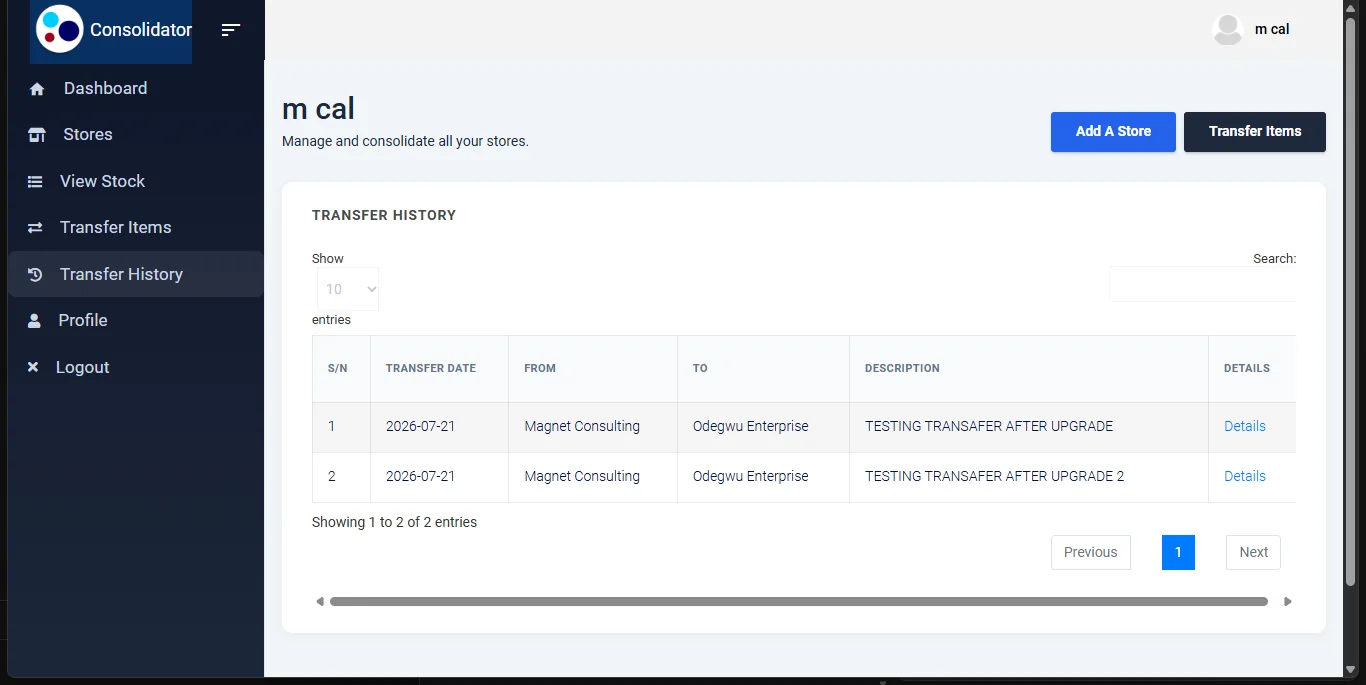
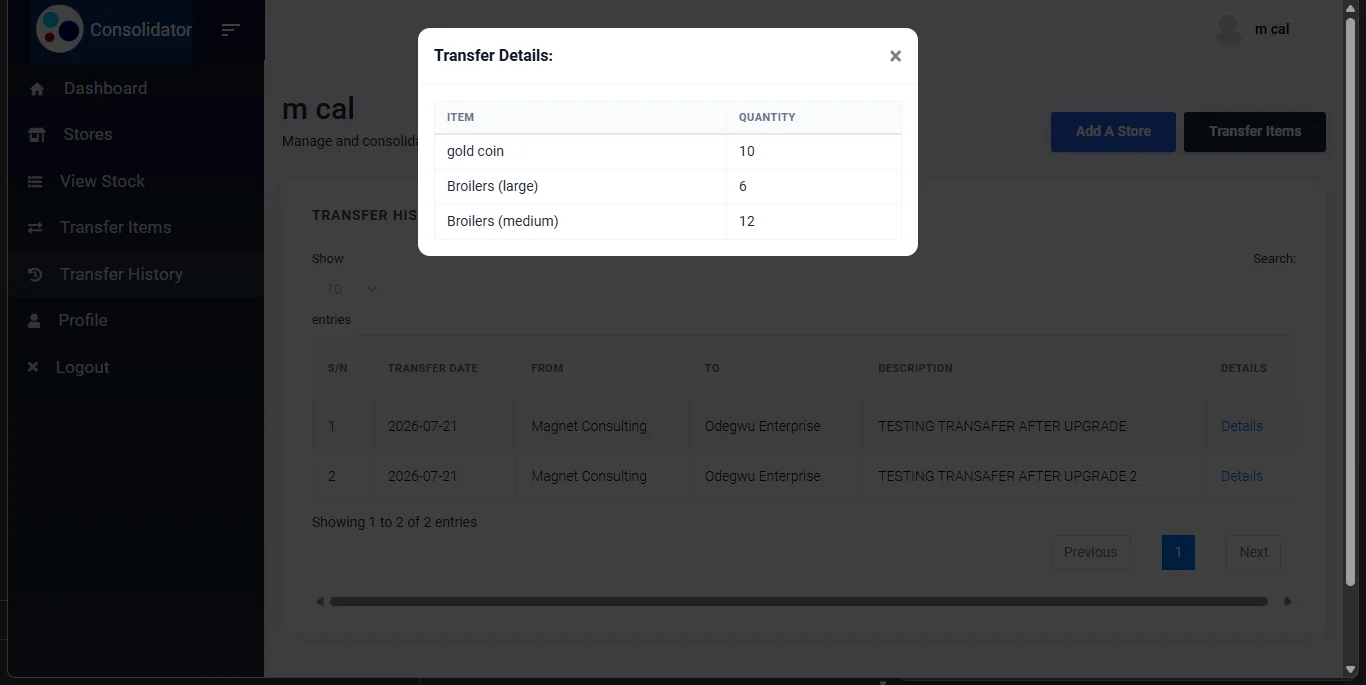
This is the record to reach for when a branch says stock never arrived, or when two people are not sure whether a movement was entered twice.
16. Stores
The Stores menu item shows one row per store — Sales, Cost Of Sales, Expenses and Profit and Loss — with a Total row, for the period in the from and to boxes at the top right. It opens on the current month; choose other dates and click Apply. The chosen span is printed under the heading.
For a fuller picture with gross profit, margins, the previous period and monthly trends, use Reports → Profit & loss (section 11.2).
17. Profile, and signing out
Profile shows the User Name and Email Address this Consolidator runs under. Both are read-only here.
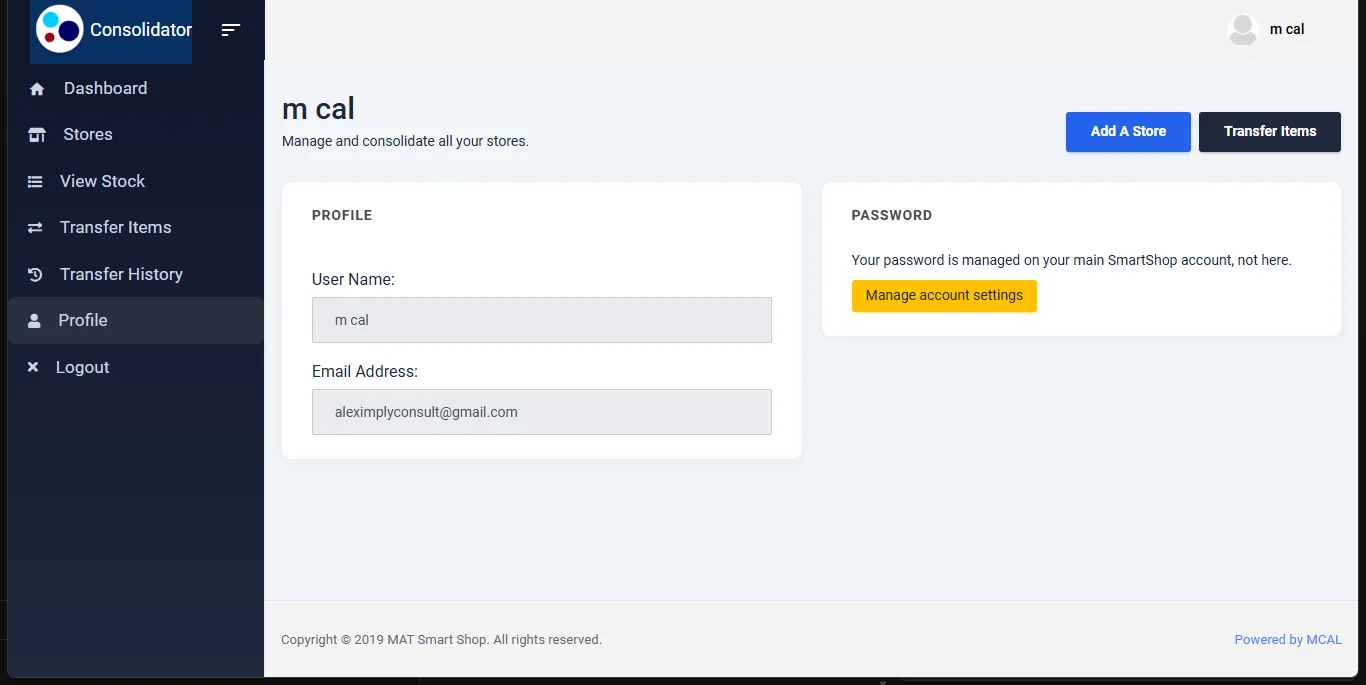
Your password and account settings live on your main Smart Shop account, not in the Consolidator — the Manage account settings button takes you there. There is nothing to change on this page; it exists so you can confirm which account you are looking at the group through, which matters if you hold more than one.
Logout (menu, or under your name at the top right) signs you out of the Consolidator tab and returns you to its start page. Your main Smart Shop session in the other tab is untouched — closing the Consolidator does not sign you out of your shop.
18. Dates: which control drives what
| Page | Control | Opens on | What it changes |
|---|---|---|---|
| Dashboard | The date bar under the greeting | 30 days, then your last choice | Everything on the Dashboard except Stock value (always today), Recent transfers and the store cards' details. Customers owe you and You owe suppliers use only the end date. |
| Reports | The date bar above the tabs | This month, then your last choice | Store comparison, Profit & loss, Sales analysis, Items across stores and Expenses. Not Stock & transfers or Money owed, which are always as of today. |
| Stores | The from and to boxes with Apply | This month | The per-store profit table on that page only. |
The Dashboard and Reports remember their dates separately, so they can be on different periods. If figures on the two pages do not agree, check both are on the same dates first — that alone explains most "the numbers don't match" questions. The store filter, on the other hand, is shared by both pages.
19. Known quirks and what to do about them
| What you see | Why | What to do |
|---|---|---|
| A branch's figures look too low | That branch's device has not synced recently. The Consolidator reads whatever has reached the server. | Sync the branch's phone or till, then reload. |
| A yellow line: Some figures could not be read just now, naming a store | One of that store's reports did not answer in time (most often a very large store). The totals leave that part out rather than counting it as zero. | Reload the page. If it keeps happening, open that store's own portal reports to see which one is slow. |
| The figures could not be loaded on the Dashboard, or could not be produced on a report | Your Smart Shop session has expired, or the connection dropped. | Go to the Smart Shop tab, confirm you are signed in, then reload the Consolidator. |
| Total sales on the Dashboard is a little different from Sales on the Profit & loss report | They come from the store's Sales report and its Profit & Loss report respectively, exactly as on the store's own portal — if they differ there, they differ here. | Compare like with like: Profit & loss with the store's Profit & Loss report. |
| Stock & transfers or Money owed does not change when you change the dates | Both always show things as they stand today. | Nothing — this is by design. |
| A store is missing from a chart or table | It is switched off in the store filter (its name is faded). | Click its name in the store filter to bring it back. |
| An item you sell everywhere is missing from Best sellers | Best sellers combines each store's own top five only. | Use Reports → Items across stores. |
| The same product appears twice on View Stock or in the reports, each with zeros or dashes in the other store's column | It is spelt differently in the two stores, so it is not recognised as one product. | Rename it so every store uses the identical name — or, on your next transfer, match it by hand and tick Rename it there. |
| An orange warning on View Stock naming a store, whose column is all zeros | That store's stock could not be loaded on this attempt. | Reload the page. If it persists, open the store itself and confirm it is healthy. |
| A transferred item's price looks wrong in the receiving store | Update price there was left ticked, so the transfer's price replaced that store's. | Correct the price in that store; untick the box next time for items that branch prices differently. |
| Update Prices shows an item as not in this store when the store does have it | The store spells it differently, and not closely enough to be offered as a closest match. | Use the store's exact name in your list, or change that price in the store itself. |
| A branch still sells at the old price after Update Prices | Its phone or till has not synced since the change. | Sync that device. The dashboard shows the new price straight away. |
| Save says the transfer did not complete | Part of it may have been saved — a transfer is not saved as one unit. | Check Transfer History for what went through, reverse anything wrong, then reload the page before trying again. |
| The page looks unstyled, or the old blue menu still shows | Your browser kept an old copy of the page. | Press Ctrl+F5 to reload it fully. |
20. Quick reference
| I want to… | Go to |
|---|---|
| See how all my shops did this month | Dashboard → This month → the six cards |
| See what actually came in | Dashboard → Money received |
| See who owes me, everywhere | Dashboard → Customers owe you; names in Reports → Money owed |
| Find out what needs doing | Dashboard → Needs your attention |
| Compare branches side by side | Dashboard → Store performance; every figure in Reports → Store comparison |
| Get one profit figure for the whole group | Reports → Profit & loss → All stores column |
| Know when my shops are busiest | Reports → Sales analysis → Busiest times |
| See how each cashier or till did | Reports → Sales analysis → Who sold |
| See what sold, item by item, in every branch | Reports → Items across stores |
| Find items priced differently between branches | Reports → Items across stores → Same item, different price |
| Decide what to move instead of reordering | Reports → Stock & transfers → Suggested transfers |
| Check whether another branch has an item | View Stock → search the product name |
| See which expenses are growing | Reports → Expenses |
| Print a report for a meeting | Reports → the tab → Print |
| Move goods between branches | Transfer Items |
| Set a branch's price while sending it stock | Transfer Items → Selling Price |
| Send stock to an item another branch names differently | Transfer Items → Validate → search under "Not in the destination store" |
| Change a price in every branch at once | Update Prices → tick the stores → Excel file or Scan a price list |
| Prove a transfer happened | Transfer History → Details |
| Work inside one branch | Dashboard → its card → Open store |
| Bring in another shop | Add a store |
| Stop seeing a shop here | Its card → ✕ → Yes, remove |